Check three numbers on your monthly statements: a staffing ratio of 60% or more, under two months of cash, and an operating deficit before depreciation. Each one is a warning sign. The more warning signs a Y had, the more often it ran into trouble within two years.
The full report, free. 34 pages and 22 charts: each sign by size band and region, what the Ys that recovered did, questions for your board, and a worksheet for your own statements.
Download the PDFThe three warning signs
Each sign has a Healthy, Watch and Warning level. Warning is where the risk steps up in the data. Watch is the band just short of it, set so you see the number moving while there is room to act.
| Sign | What it measures | Healthy | Watch | Warning |
|---|---|---|---|---|
| Staffing ratio | Personnel cost as a share of revenue, excluding investment income | Under 55% | 55% to 60% | 60% or more |
| Months of cash | Cash and savings against one month of expenses, excluding depreciation | 3 months or more | 2 to 3 months | Under 2 months |
| Operating margin before depreciation | Operating revenue less expenses before depreciation, as a share of revenue | +5% or better | 0 to +5% | Below zero |
The median Y in FY2024 had a staffing ratio of 57%, 3.1 months of cash and a margin of 4%: on Watch for staffing and margin, and just inside Healthy on cash.
The more signs, the more often Ys ran into trouble
We followed 695 Ys from FY2022 through FY2024. In FY2022, 63% of them had none of the three warning signs, and they ran into trouble 18% of the time. With one sign, 39%. With two, 51%. With all three, 79%.
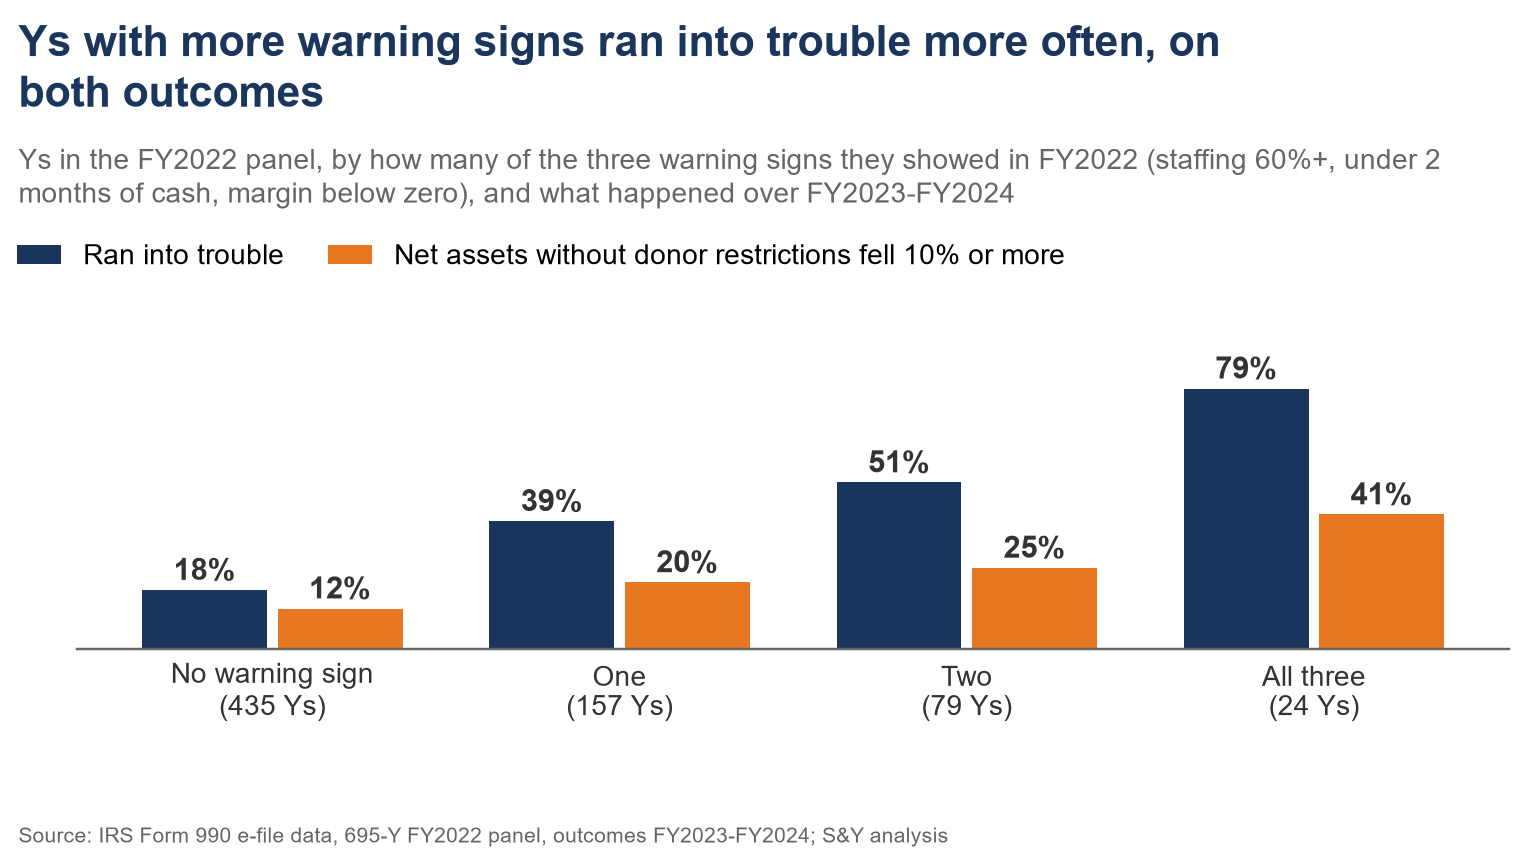
A Y ran into trouble if it ran an operating deficit before depreciation in both FY2023 and FY2024, or ended FY2024 with under one month of cash. Cash and margin are part of that definition, so we also checked an outcome none of the signs is built on: net assets without donor restrictions falling 10% or more. That rose on the same gradient, from 12% of Ys with no warning sign to 41% with all three.
How many signs a Y shows matters more than which one. Ys whose only warning sign was staffing ran into trouble 35% of the time, cash 46% and margin 31%, against 18% for Ys with none.
The count has moved
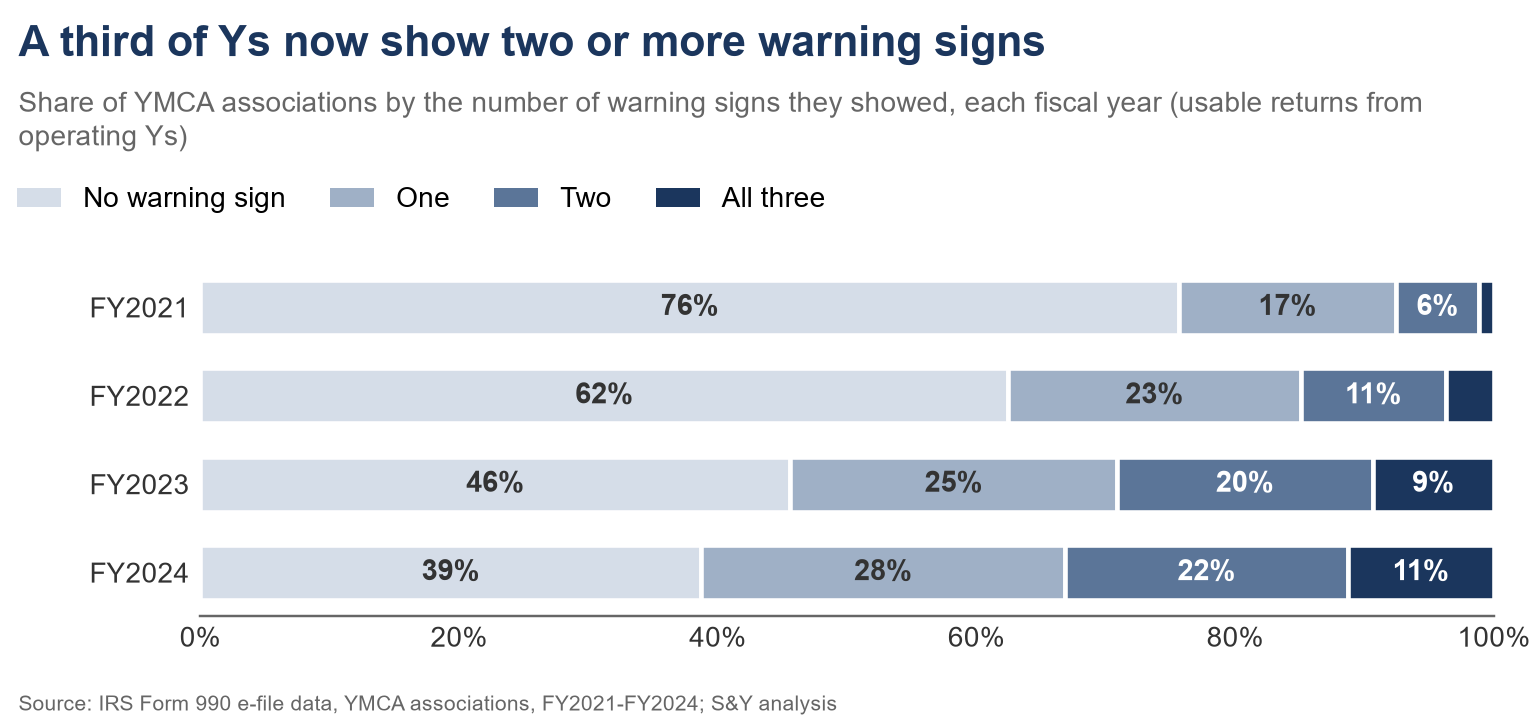
In FY2021, 8% of Ys had two or more warning signs. By FY2024 it was 33%, and 11% had all three, up from 1%. The share with none fell from 76% to 39%.
Count your own
Your 990 is a year or two old. Your monthly statements are not. Use the last twelve months of your statements and enter the amounts below. Each sign shows its level as soon as its boxes are filled in.
All amounts in dollars, last twelve months unless the label says month end.
Staffing ratio
Months of cash
Operating margin before depreciation
Uses total revenue, investment income, total expenses and depreciation from above.
Fill in all three signs to count.
The calculation runs in your browser. Nothing you enter is sent or saved.
Then bring your finance committee one question: how many of the three warning signs does our Y show today, and which way is each number moving?
The full report's worksheet goes further: peer figures for Ys your size on each sign, months of cash read beside cash and investments, and facility age and reinvestment, which carry no warning level.